Static data can be made interactive using the static.analysis.page
function, and web services can be set up using
the build.service function.
This documentation page describes how to put these two systems together to build an application which can take user input, run a handler function on the R side, and return interactive data to the user.
Rook version >= 1.1 and fork are required for full functionality of the examples in this vignette. I am going to check if they are available.
## Rook >= 1.1 or fork is not available, so although you can still use the static reporting
## features of AnalysisPageServer, and deploy dynamic servers with FastRWeb and RApache, you
## will not be able to deploy using Rook/Rhttpd, or build this vignette properly. You'll see
## the message "Rook >= 1.1 + fork not available" at all the points in this vignette where
## Rook+fork would have been required: starting the server, querying the server and stopping
## the server. If you want you can install/update the missing dependencies like this:
##
##   install.packages("fork")
##   install.packages("devtools")
##   library(devtools)
##   install_github("Rook", "jeffreyhorner")
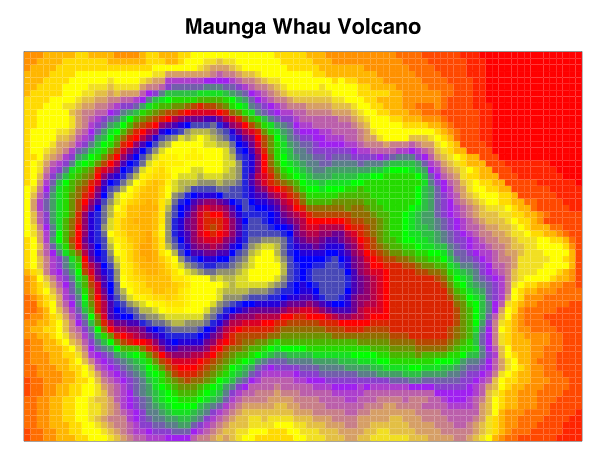
The last example from the Non-interactive Servers page was a plot of an image in which the coloring was taken from a URL query parameter.
This is how we built that service:
volcano <- build.service(function(colors = c("red","white","purple"))  {
  plotfile <- tempfile(fileext = ".png")
  png(plotfile, width = 600, height = 400)
  par(mar=c(1, 1, 4, 1))
  col <- colorRampPalette(colors)(50)
  image(datasets::volcano, xaxt = "n", yaxt = "n", main = "Maunga Whau Volcano",
        col = col, cex.main = 2)
  dev.off()

  plot.data <- readBin(plotfile, "raw", n = file.info(plotfile)[, "size"])

  new.response(body = plot.data,
     content.type = "image/png")
}, name = "volcano")
The last example from the Static Content page had the same plot with lots of front-end interactivity (rollover, zoom, filter, etc) but no possibility for the user to modify the results. That page was made like this:
x <- rep(1:nrow(volcano), each = ncol(volcano))
y <- rep(1:ncol(volcano), nrow(volcano))
volcano.cells <- data.frame(x = x, y = y, Height = as.vector(t(volcano)))
plotfile3 <- tempfile(fileext = ".svg")
svg(filename = plotfile3, width = 9, height = 7)
image(volcano, xaxt = "n", yaxt = "n", main = "Maunga Whau Volcano")
dev.off()
result <- static.analysis.page(outdir = "static-example3",
                     svg.files = plotfile3,
                     dfs = volcano.cells,
                     show.xy = TRUE,
                     title = "Maunga Whau Volcano")
Using the complete AnalysisPageServer system we can build an application that not only combines these two features—customization via parameters and plot/data interactivity—but also features a user interface to select parameter values.
In order to do this we'll use the new.analysis.page constructor
instead of build.service, and instead of calling the analysis URL
directly we'll open the application through the analysis-page-server.html landing page:
port <- 5333
library(AnalysisPageServer)
volcano.handler <- function(color1 = "red",
                                      color2 = "blue")  {

  par(mar=c(1, 1, 4, 1))
  chosen.colors <- c(color1, color2)
  col <- colorRampPalette(chosen.colors)(50)
  image(datasets::volcano, xaxt = "n", yaxt = "n", main = "Maunga Whau Volcano",
        col = col, cex.main = 2)

  return(volcano.cells)
}
volcano.page <- new.analysis.page(handler = volcano.handler,
                                  name = "volcano",
                                  description = "Draw the Maunga Whau Volcano in Two Colors")
reg <- new.registry(volcano.page)
srv <- startRookAnalysisPageServer(reg, port = port)
If you are running this example yourself you should register this handler now to prevent yourself from leaving running servers behind:
on.exit(kill.process(srv))
You can get the full URL to the landing page:
rook.analysis.page.server.landing.page(srv)
## [1] "\"Rook >= 1.1 + fork not available\"/dist-aps/analysis-page-server.html"
Now open that URL in your browser:
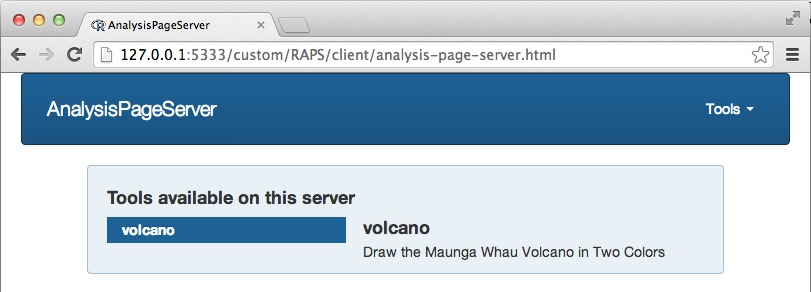
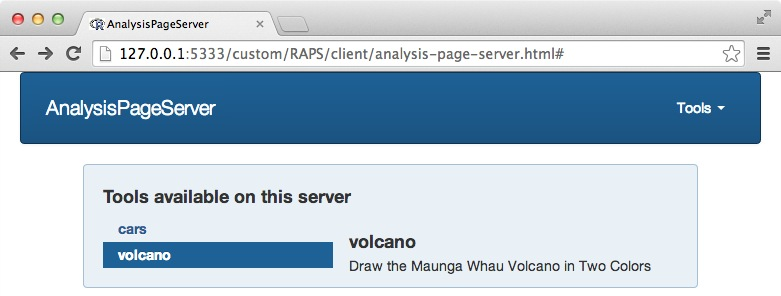
This is the default landing page. The main feature is an index
of all the AnalysisPages that we included in our Registry. Right now
there is only one.
Clicking on the "Tools" menu in the upper right opens a drop-down so you can jump to another tool. In this example there is only one page there:
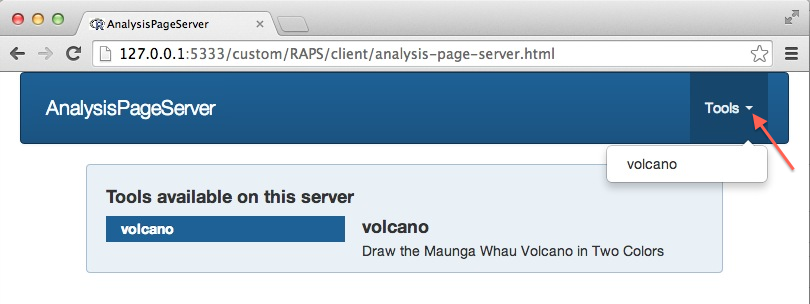
Click on "volcano" (either on the main landing page or in the "Tools" menu) to go to its "primary parameter area".
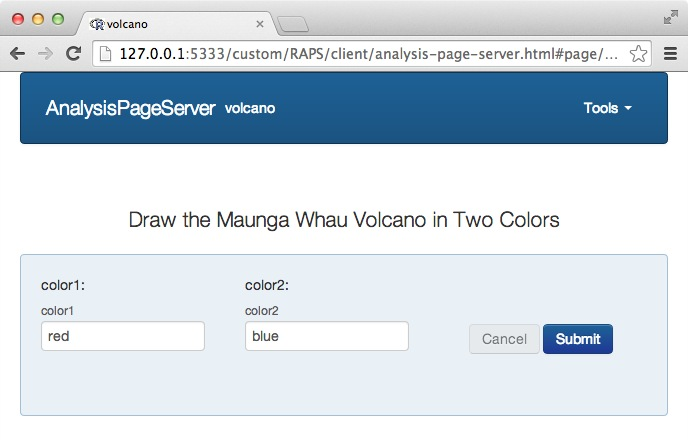
Now we can see the two arguments of the handler function, color1 and
color2, have been rendered as HTML text inputs, and prepopulated
with their default values. (This is default behavior, but there is a
rich syntax to define complex parameters, and this is explored below.)
Also note that the URL has updated. This
new URL, with the suffix #page/volcano/primary,
will automatically jump to the primary parameter area for the
volcano page. Clicking on Submit takes us to the analysis result:
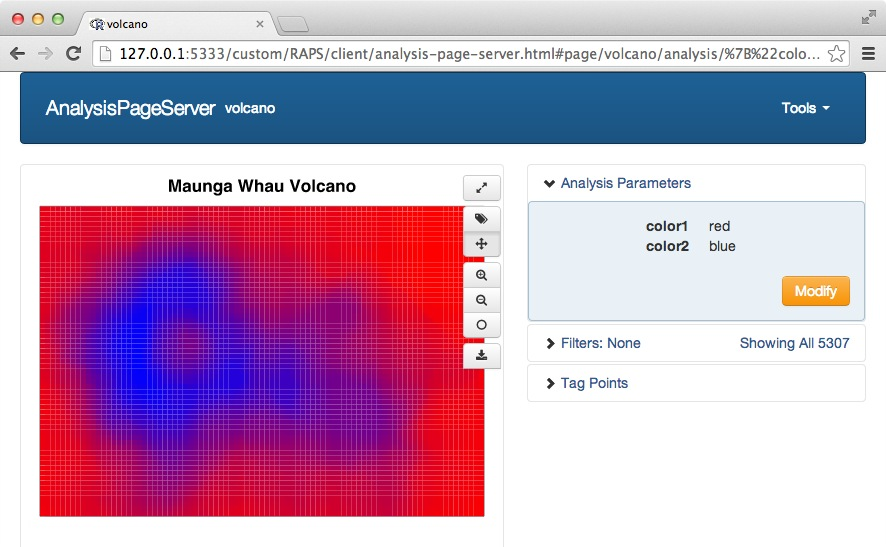
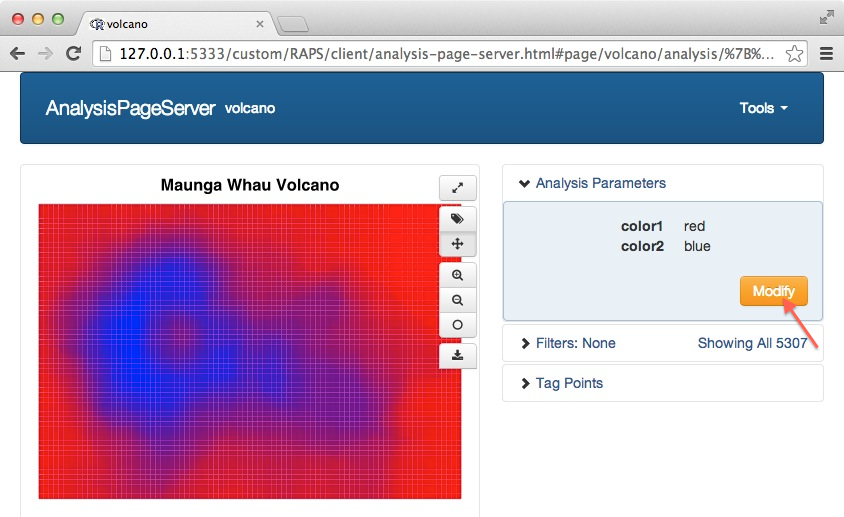
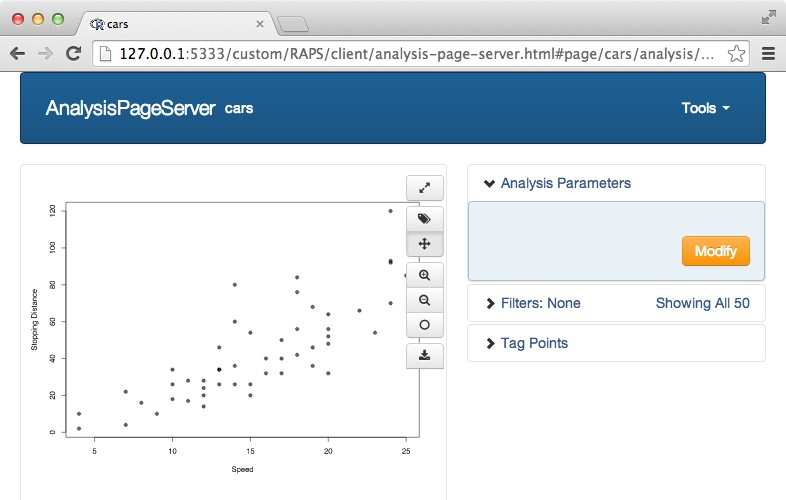
This page features the plot (top left), a control area (top right) and the data table (below, but not visible on this screen shot).
The interactivites discussed on the Interactivity documentation page, including roll-over, filtering, zooming, tagging and download, are all available with this deployment. Since they are described in detail there no more will be said about them here. What's new is the "Analysis Parameters" section, which is a condensed version of the primary parmeter area and lets the user see the inputs to the function. This section can also be used to repeat the analysis with modified parameters. First, click on Modify:
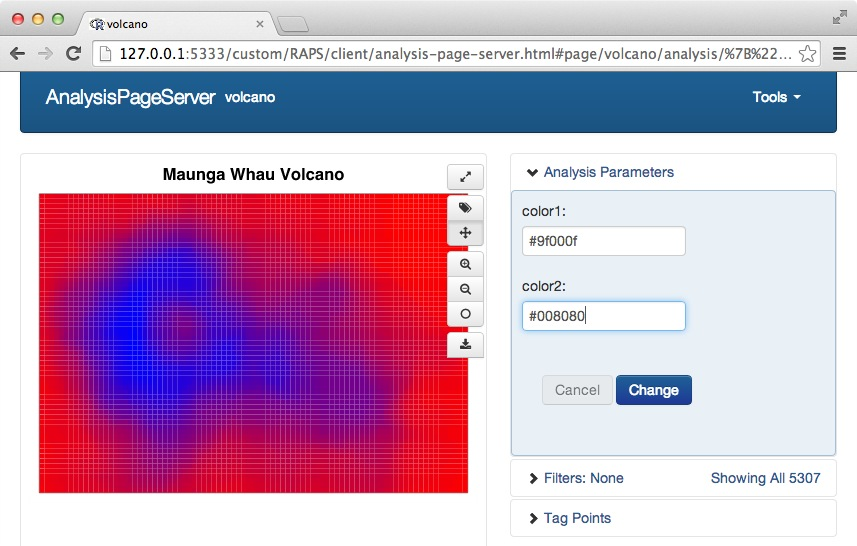
Then input the new values and click "Change":
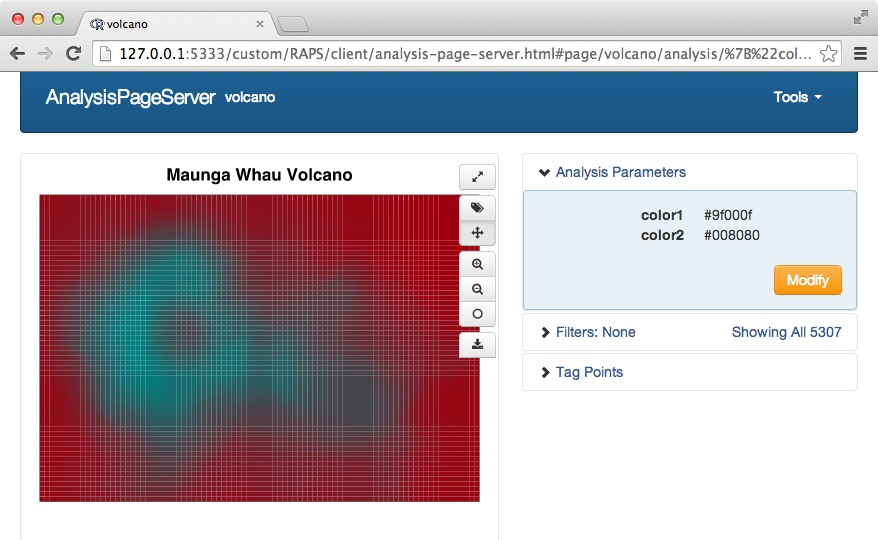
and, voilà, the Maunga Whau Volcano in cranberry and teal:
Let's turn off the server in preparation for the next example.
kill.process(srv)
"Rook >= 1.1 + fork not available"
If your registry has multiple AnalysisPages then each one will
become a different tool in your
application. Let's add a boring page that has no parameters. It will plot
the speeds and distances from the cars dataset.
We have to duplicate the columns if we actually want to display the
data because the $x and $y fields are always stripped.
cars.df <- cbind(x = cars$speed, y = cars$dist, cars)
cars.page <- new.analysis.page(function() {
  plot(cars.df$x, cars.df$y, xlab = "Speed", ylab =
       "Stopping Distance", pch = 19, col = adjustcolor(1, alpha.f = 0.6))
  cars.df
}, name = "cars", description = "Speed and Stopping Distances of Cars")
reg <- new.registry(cars.page, volcano.page)
srv <- startRookAnalysisPageServer(reg, port = port)
(No need to do the on.exit(kill.process(srv)) again since the old
handler is still registered.)
Now the landing page has two tools on it.
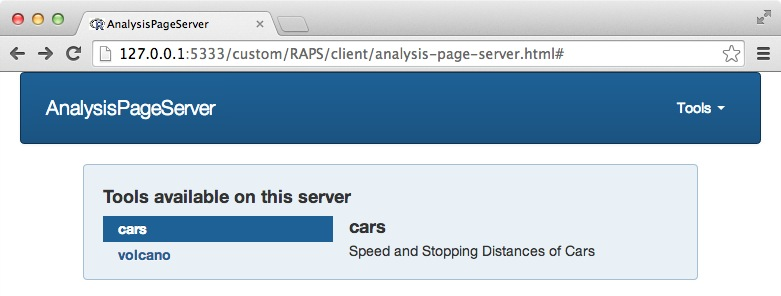
If you roll over the name of the tool you can see a short description:
The cars page has an empty parameter area:
![]()
And the plot:
kill.process(srv)
"Rook >= 1.1 + fork not available"
Each of the color parameters for the volcano example was rendered as a simple text input. Depending on the
default values of your handler function, different types of widgets will be used. The functions
default.param.set and default.param introspect your handler
function and decide what type of widget to render. These are called
automatically by the constructor for AnalysisPages,
new.analysis.page, if you
don't provide a param.set argument explicitly. By using different default arguments you can build relatively complicated
input widgets. For example, a vector of length greater than 1 becomes
a drop-down menu.
These default parameters are covenient but they are not very good
engineering practices, because the default value is no longer an
actual parameter value but instead a signal for widget type. In
particular, if you
don't provide skip.checks = TRUE to new.analysis.page() it will actually run your handler
function once with the default values to make sure
you've given it something reasonable.
To specify your input widgets explicitly
you'll build an AnalysisPageParam for each input variable, and then put them all together into an
AnalysisPageParamSet using the constructor param.set().
These are the constructors for the "atomic"
AnalysisPageParams. These result in a single value being passed to
the function.
| constructor | Description | Type within R |
|---|---|---|
simple.param |
Simple text input elements | Arbitrary Length-1 character vector |
slider.param |
Numeric slider-type parameter with min, max and step-size | Length-1 numeric vector |
select.param |
Select from a drop-down list or radio group | Length-1 character vector, but only from those defined in the drop-down choices |
bool.param |
Toggle button | TRUE or FALSE, according to whether the button is pressed |
combobox.param |
Combobox-type parameter with search box and dropdown | Length-1 character vector |
The combobox.param takes the user input and calls back to the server to get a list of search hits. It requires including
a service-type (non-interactive) page to serve these search hits (or otherwise providing that service from some other accessible URL).
These constructors, which are variants of the atomic constructors, result in multiple selections:
| constructor | allow.multiple parameter |
Description | Type within R |
|---|---|---|---|
select.param |
TRUE |
Select multiple values from a dropdown | Character vector of selected values. |
combobox.param |
TRUE |
Combobox-type parameter with search box and dropdown, and option to select multiple values | Character vector of selected values |
These two constructors build more complex widgets that result in either arrays or lists:
| constructor | Description | Type within R |
|---|---|---|
array.param |
Expandable array of identical parameters | List or vector of similarly-typed values (the choice of list or vector is decided by toJSON, since there is no difference in the front-end) |
compound.param |
Group of related parameters | The related parameters are packed into a list (or possibly a named vector) and sent to your function |
Since the function parameter values are always built by toJSON you should plan to write things a bit defensively. The main thing to remember
is that text-input numbers are passed as strings, so you have to call as.numeric() for a simple parameter
(although this is not necessary for a slider param), and that, given a JSON array, toJSON will
decide to build an R vector or list according to whether the objects have the same type. So don't assume you have either, and
either cast your vectors to lists with as.list or avoid using the $ operator, which doesn't work on vectors.
The examples that follow attempt to demonstrate the main features of the AnalysisPageParam system. Reading the
documentation of the individual constructors will contain more information for specific cases.
For the first example we will re-use the same handler function from the volcano plot but have its input widgets be drop-downs:
color.choices <- c("red", "orange", "yellow", "green", "blue", "purple")
color1 <- select.param(name = "color1", label = "Low Color",
  description = "<strong>Select</strong> a color for the lowest parts of the volcano", choices = color.choices)
color2 <- select.param(name = "color2", label = "High Color",
  description = "<strong>Select</strong> a color for the highest parts of the volcano", choices = color.choices)
color.pset <- param.set(color1, color2)
volcano.page <- new.analysis.page(handler = volcano.handler,
                                  param.set = color.pset,
                                  name = "volcano",
                                  description = "Draw the Maunga Whau Volcano in Two Colors")
reg <- new.registry(volcano.page)
srv <- startRookAnalysisPageServer(reg, port = port)
Now the parameters look like this:
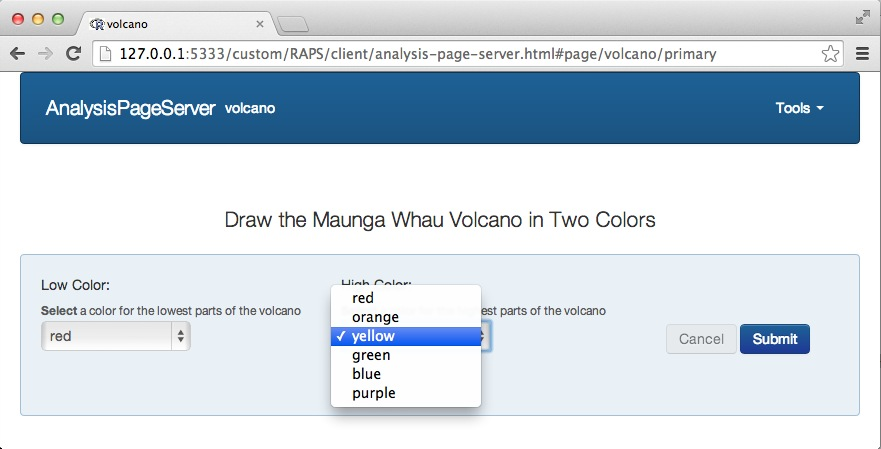
Note that we've also had a chance to give the parameter a prettier display name ("Low Color" and "High Color") and a slightly longer description. This can really help to improve the user experience, and it doesn't require any modification to your handler function.
Also, since we've isolated the construction of the parameter widgets, we can define our own constructors, and even re-use them between pages. For example, if our user has to choose between six colors in several different pages, we can define a color parameter constructor like this:
color.param <- function(name = "color",
                        label = "Color",
                        description = "<strong>Select</strong> a color from the list", ...)  {
  select.param(name = name, label = label, description = description,
               choices = color.choices, ...)
}
And then wherever we need a color selector we've got the same one:
color1 <- color.param("color1", label = "Low Color")
color2 <- color.param("color1", label = "High Color")
kill.process(srv)
"Rook >= 1.1 + fork not available"
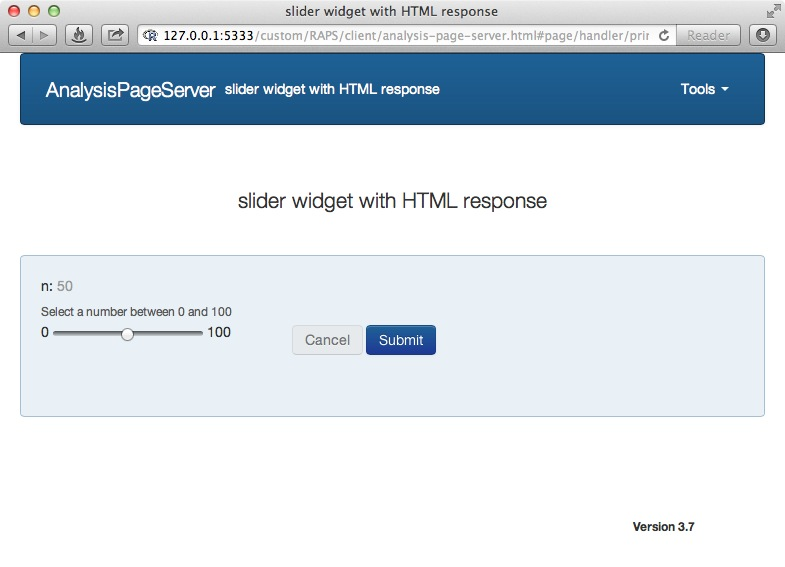
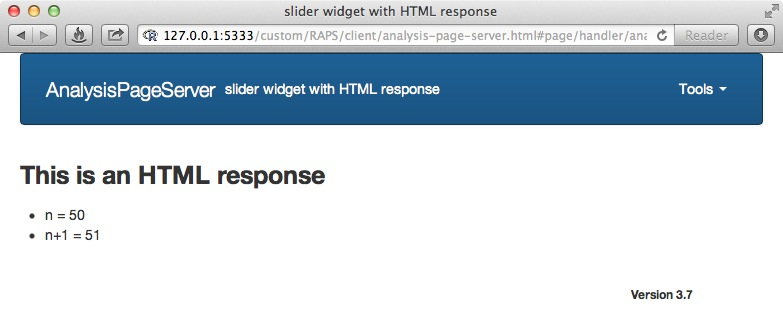
This example shows off the slider widget, and also shows how to have your handler return HTML instead of the plot/dataset combination.
slider <- slider.param(name = "n",  min = 0, max = 100, step = 1, value = 50,
                       description = "Select a number between 0 and 100")
handler <- function(n=50)  {
  ## n is already numeric for a slider---no need to cast with as.numeric(n)
  html <- paste0("<h3>This is an HTML response</h3>",
                 "<ul>",
                 "  <li>n = ", n, "</li>",
                 "  <li>n+1 = ", n+1, "</li>",
                 "</ul>")

  ## This is how to have your page return arbitrary HTML, rather than
  ## the typical plot/dataset combination
  new.datanode.html("html", html)
}
slider.page <- new.analysis.page(handler,
   param.set = param.set(slider),
   annotate.plot = FALSE,
   annotate.data.frame = FALSE,
   no.plot = TRUE,
   label  = "slider widget with HTML response")
reg <- new.registry(slider.page)
srv <- startRookAnalysisPageServer(reg, port = port)
Here is the widget:
And here is the rendered HTML response:
kill.process(srv)
"Rook >= 1.1 + fork not available"
The volcano plot is really a lot nicer with more colors so that finer differences in color are revealed.
We could add a third color like this:
volcano.handler <- function(color1 = "red",
                            color2 = "blue",
                            color3 = "green")  {

  par(mar=c(1, 1, 4, 1))
  chosen.colors <- c(color1, color2, color3)
  col <- colorRampPalette(chosen.colors)(50)
  image(datasets::volcano, xaxt = "n", yaxt = "n", main = "Maunga Whau Volcano",
        col = col, cex.main = 2)

  return(volcano.cells)
}
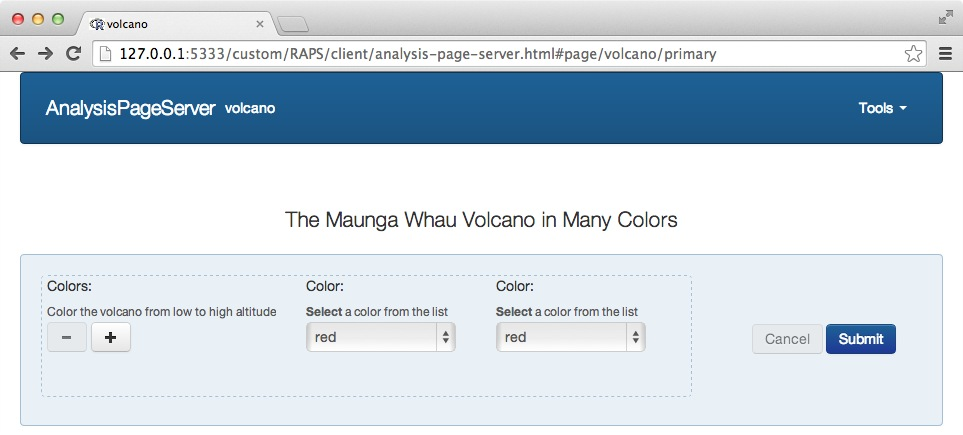
What if the user wants 4 or more colors? One solution is to use an array-type parameter. This is done with
the constructor array.param. We pass a "prototype", in this case a single color picker, and
the user can add as many color pickers to the array as she wishes. We'll require that
the user have at least 2 colors, since a single color would be useless.
volcano.handler2 <- function(colors = c("red","blue"))  {

  par(mar=c(1, 1, 4, 1))
  col <- colorRampPalette(colors)(50)
  image(datasets::volcano, xaxt = "n", yaxt = "n", main = "Maunga Whau Volcano",
        col = col, cex.main = 2)

  return(volcano.cells)
}

one.color <- color.param()
color.array <- array.param(name = "colors", label = "Colors",
                           description = "Color the volcano from low to high altitude",
                           prototype = one.color,
                           min = 2, start = 2)
## Build an "AnalysisPageParamSet" with just 1 parameter, an array-type parameter
array.pset <- param.set(color.array)

volcano.page <- new.analysis.page(handler = volcano.handler2,
                                  param.set = array.pset,
                                  name = "volcano",
                                  description = "The Maunga Whau Volcano in Many Colors")
reg <- new.registry(volcano.page)
srv <- startRookAnalysisPageServer(reg, port = port)
Now the parameter area starts like this:
(If you are trying to follow along yourself and you still see the 2-parameter example instead of the array then you may need to clear some cache, or directly refresh the parameter resource http://127.0.0.1:5333/custom/RAPS/R/params?page=volcano.)
The - and + buttons remove and add single color widgets respectively. Note that the - button starts disabled since
we said the minimum number of colors would be 2. Click on the + to get more color widgets:
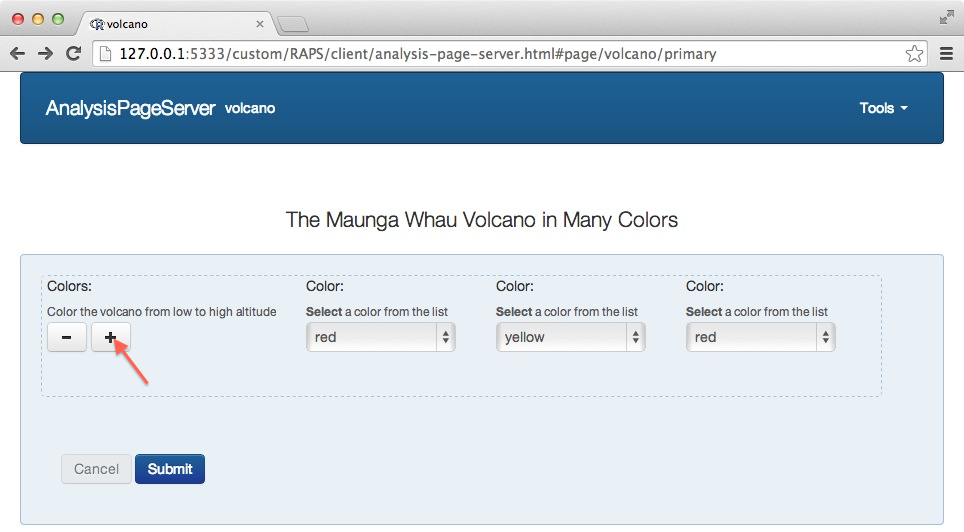
And so on:
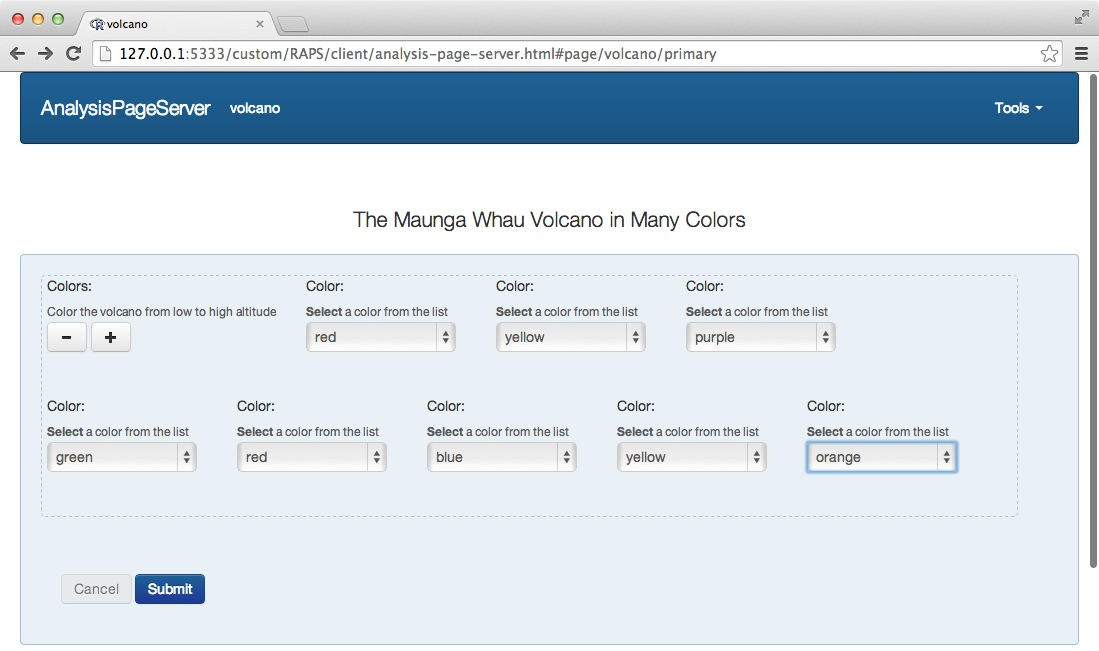
and submit
kill.process(srv)
"Rook >= 1.1 + fork not available"
Another way to allow for multiple selections is with the allow.multiple parameter of the select.param
constructor:
multi.color.selector <- select.param(name = "color", label = "Color", description = "Select multiple colors",
                                     choices = color.choices, allow.multiple = TRUE)

volcano.page <- new.analysis.page(handler = volcano.handler2,
                                  param.set = param.set(multi.color.selector),
                                  name = "volcano",
                                  description = "The Maunga Whau Volcano in Many Colors")
reg <- new.registry(volcano.page)
srv <- startRookAnalysisPageServer(reg, port = port)
Now the parameter choices render as a multiple-selection dropdown:
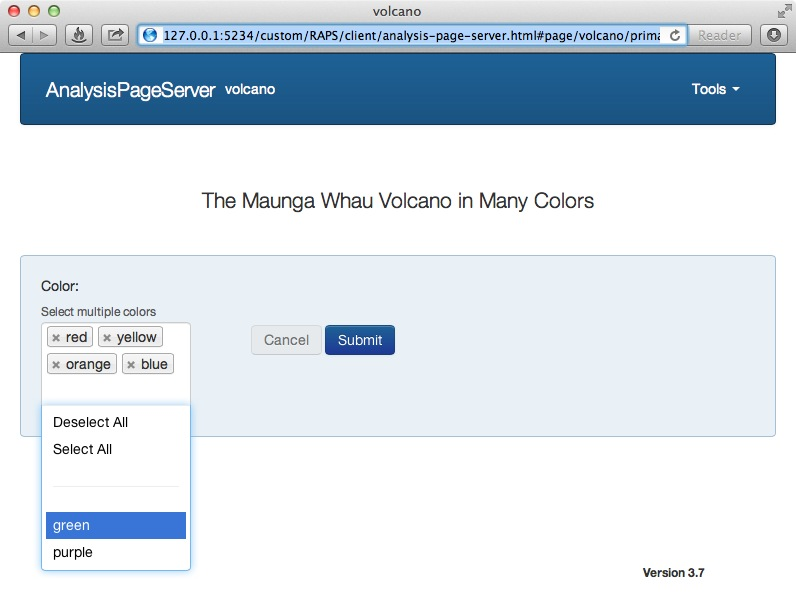
The user can select as many of the choices from the menu. As they are chosen the accumulate in
the area above. "Select All" to select the remaining choices, and "Deselect All" to clear the
selection. After selecting, the order of the choices can be changed with drag-and-drop, and
individual choices can be removed by clicking the small x.
kill.process(srv)
"Rook >= 1.1 + fork not available"
A combobox is an input widget that has both a text entry area and then, depending on what is typed there, a dropdown.
In order to have a combobox, we'll first need to set up a service
to return the search hits. This can be served from
outside your AnalysisPage application if you can avoid
cross-domain issues. This example will include the service in the same
application.
Let's have the user choose a city in a state. First we'll choose the states from a drop-down, then choose a city.
This sets up some data structures on which we will compute:
cities <- list(IL = c("Deerfield", "Springfield", "Chicago", "Urbana"),
  CA = c("San Francisco", "San Diego", "Los Angeles", "Sacramento"),
  MA = c("Deerfield", "Springfield", "Boston", "Camridge", "Arlington"))
states <- names(cities)
The cities service will return cities in a state:
cities.service <- build.service(function(state) cities[[state]], name = "cities")
state.dropdown <- select.param(name = "state", label = "State", description = "Choose a state",
                               choices = states)

city.cbx <- combobox.param(name = "city", label = "City", description = "Choose a city",
                           uri = '/custom/RAPS/R/analysis?page="cities"&state=":statename"', dependent.params = c(statename="state"))
The ":" indicates a token within the URI which will be substituted with the value of another input widget.
The dependent.params gives the mapping from tokens to parameter names. Here we'll replace
:statename with the value of the "state" dropdown.
handler <- function(state = "MA", city = "Arlington") {
plot.new()
plot.window(0:1, 0:1)
mesg <- paste(sep = "", city, ", ", state, " is for lovers\nand data analysts.")
text(0.5, 0.5, mesg, cex = 3)
data.frame(x = numeric(), y = numeric())
}
page <- new.analysis.page(handler = handler,
param.set(state.dropdown, city.cbx),
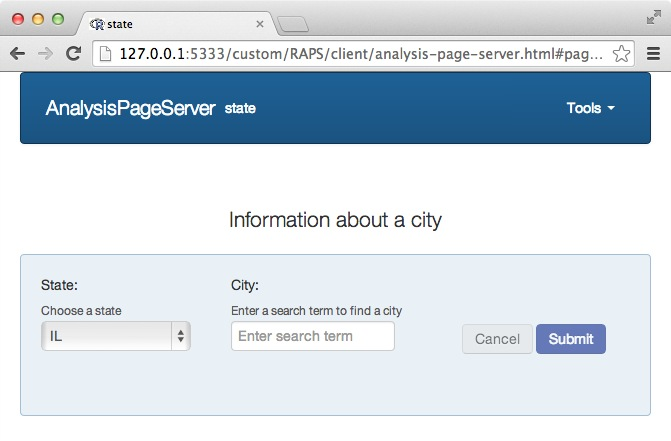
name = "state",
description = "Information about a city",
annotate.plot = FALSE)
reg <- new.registry(cities.service, page)
srv <- startRookAnalysisPageServer(reg, port = port)
The primary parameter area starts like this:
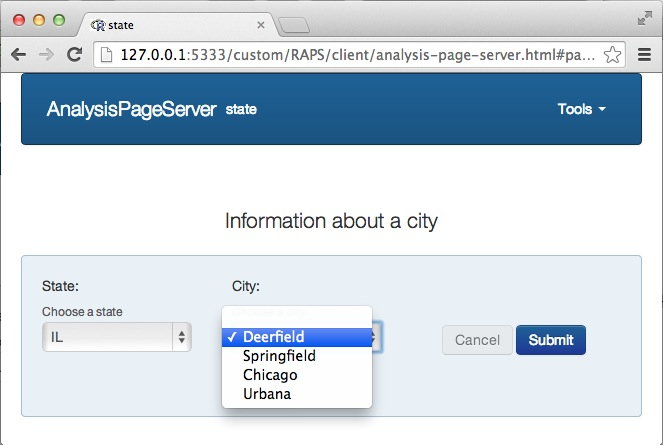
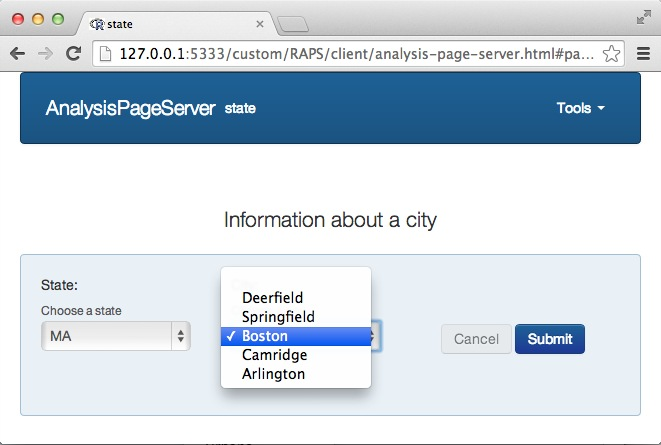
The cities available are only those in Illinois. If the user chooses a different state from the first dropdown then the second dropdown is populated with different city names:
kill.process(srv)
"Rook >= 1.1 + fork not available"
Purists might argue that while having conditionally populated dropdown menus is useful
they are not true comboboxes, which are really a text/dropdown mixed input widget. In
AnalysisPageServer that is called a self-dependent combobox. The constructor is exactly
the same, just that the widget itself is a dependent parameter, and so whatever text is
typed in gets sent.
To demonstrate, we'll create a city searching service which only returns cities within the state matching a query.
## Extra "as.list" is necessary to force creation of JSON array for length 1
city.search.service <- build.service(function(state, query) as.list(grep(query, cities[[state]], value = TRUE)),
  name = "city_search")
city.cbx <- combobox.param(name = "city", label = "City", description = "Enter a search term to find a city",
                   uri = "/custom/RAPS/R/analysis?page=\"city_search\"&state=\":statename\"&query=\":query\"",
                   dependent.params = c(statename="state", query = "city"))
Note that "city" is now dependent on itself. That will make it a true combobox. We can now rebuild the AnalysisPage
with a different AnalysisPageParameterSet.
page <- new.analysis.page(handler = handler,
  param.set(state.dropdown, city.cbx),
  name = "state",
  description = "Information about a city",
  annotate.plot = FALSE)

reg <- new.registry(city.search.service, page)
srv <- startRookAnalysisPageServer(reg, port = port)
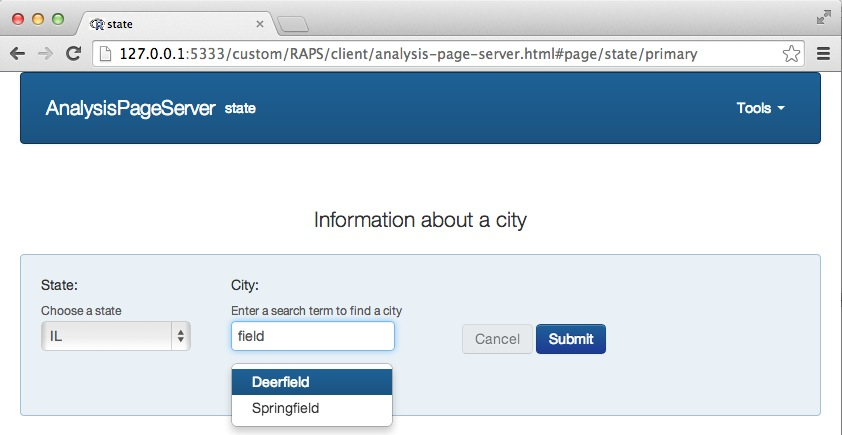
Now the widget for "city" renders as a combobox instead of a dropdown.
After you type in a search term the options render below:
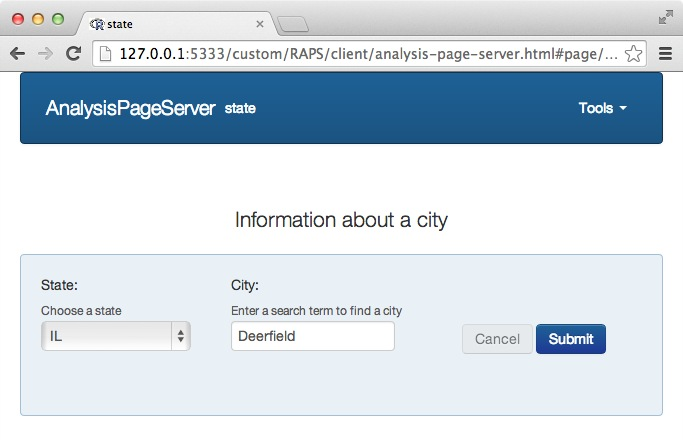
Click on one and the text box collapses to your suggestion:
The combobox feature is relatively unstable under Rook, possibly due to the quick successive AJAX calls triggered by keystrokes. You may need to restart your server frequently. However, it behaves well under RApache and FastRWeb.
kill.process(srv)
"Rook >= 1.1 + fork not available"
Until now all of the examples either had a single page or two completely independent pages,
between which no data passes. AnalysisPageServer has a very limited but still useful mechanism
to share information between the different pages in an application: persistent parameters.
Each application has a persistent parameter space, which is simply a hash-key lookup. This is maintained strictly on the client side. What the server can do is couple certain parameters to particular keys in this hash. Then all of the parameters tagged to a particular hash key are now coupled---changing one on any page changes them on all the pages.
Persistent parameters could be used for example to select a data set, then have all of the pages analyze the same data set. Or they could be used for some finer customizations. For example, if each page were a different volcano, you might want to have the color array be persistent between the pages.
Let's work up the color example. We'll make an application that has two pages.
The key to this whole thing working is to set the argument persistent in whichever parameter
you want to be persistent. In this example we'll have two pages that each take a single parameter called "word".
horiz.handler <- function(word = "word")  {
  plot.new()
  plot.window(0:1, 0:1)
  text(0.5, 0.5, word)
  data.frame(x = numeric(), y = numeric())
}

vert.handler <- function(word = "word")  {
  plot.new()
  plot.window(0:1, 0:1)
  text(0.5, 0.5, word, srt = 90)
  data.frame(x = numeric(), y = numeric())
}
Next, the "word" parameter on both pages is coupled to the persistent "word" parameter.
word <- simple.param(name = "word", persistent = "word")
horiz.page <- new.analysis.page(horiz.handler, param.set(word), name = "horiz", label = "Horizontal")
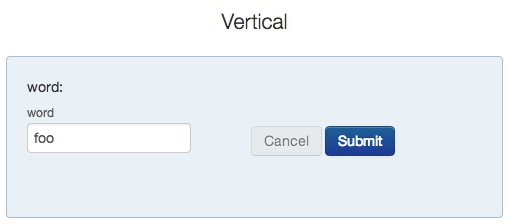
vert.page <- new.analysis.page(vert.handler, param.set(word), name = "vert", label = "Vertical")
reg <- new.registry(horiz.page, vert.page)
srv <- startRookAnalysisPageServer(reg, port = port)
Here is the primary parameter area for the first page. We'll type in "foo" as the input word:
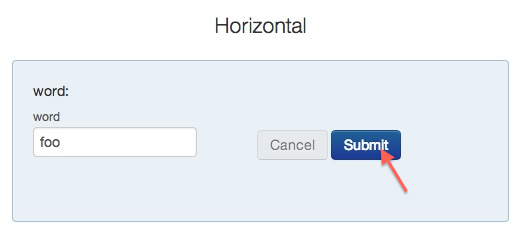
The "foo" value does not persist until the user clicks "Submit". After that, when the user next goes to the other tool, "word" will start already with the value "foo":
kill.process(srv)
"Rook >= 1.1 + fork not available"
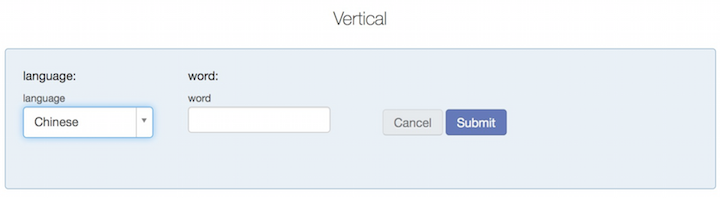
Persistent parameters can remember a single value. Sometimes richer
dependencies exist. For example, imagine that the user should first
select a language then type in a word in that language. We can make
both the language and word persistent between the pages using the
persistent argument. However, if the user switches, say, from French
back to English, then the French word would persist. If we want the
word for each language to persist independently then we can use
conditionally persistent parameters. To do this, use the
persistent.dependencies argument to your Parameter constructor:
## First we'll rewrite the two handlers to accept
## a "language" parameter, and display "language: word"
## instead of just "word"
horiz.handler <- function(language = "English",
                          word = "word")  {
  plot.new()
  plot.window(0:1, 0:1)
  text(0.5, 0.5, paste0(language, ": ", word))
  data.frame(x = numeric(), y = numeric())
}

vert.handler <- function(language = "English",
                         word = "word")  {
  plot.new()
  plot.window(0:1, 0:1)
  text(0.5, 0.5, paste0(language, ": ", word), srt = 90)
  data.frame(x = numeric(), y = numeric())
}

## Now define language as a dropdown parameter, and make it
## persistent between the two pages.
language <- select.param(name = "language",
                         value = "English",
                         choices = c("English","Wolof","Chinese","Arabic","Klingon"),
                         persistent = "language")

## Then define the word parameter the same as above
## but make its persistence dependent on language.
word <- simple.param(name = "word", persistent = "word",
                     persistent.dependencies = "language")

## Finally, build the App and deploy:
horiz.page <- new.analysis.page(horiz.handler, param.set(language, word), name = "horiz", label = "Horizontal")
vert.page <- new.analysis.page(vert.handler, param.set(language, word), name = "vert", label = "Vertical")

reg <- new.registry(horiz.page, vert.page)


srv <- startRookAnalysisPageServer(reg, port = port)
Let's see how it looks.
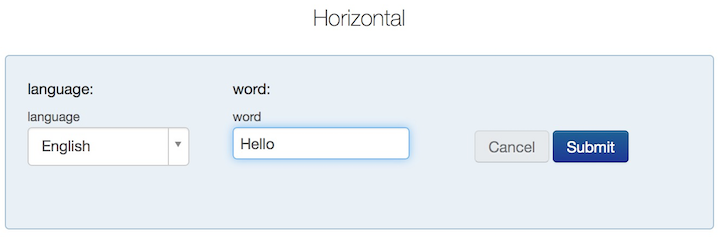
First we'll start on the Horizontal page, select English language
and type in the word Hello:
The result:
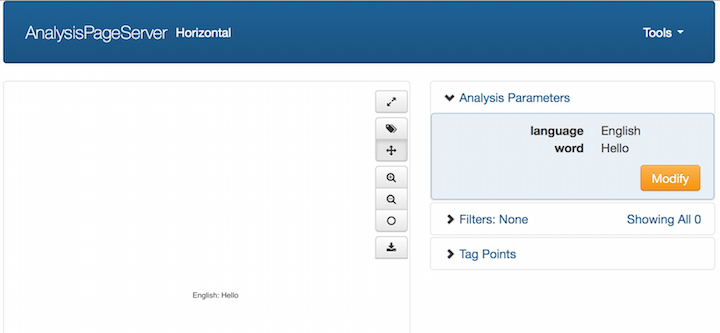
Next we'll modify the analysis parameters. Let's switch the language to Wolof,
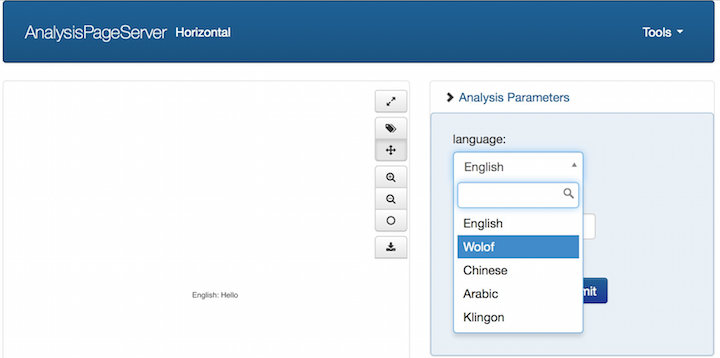
and make a plot with a Wolof word:
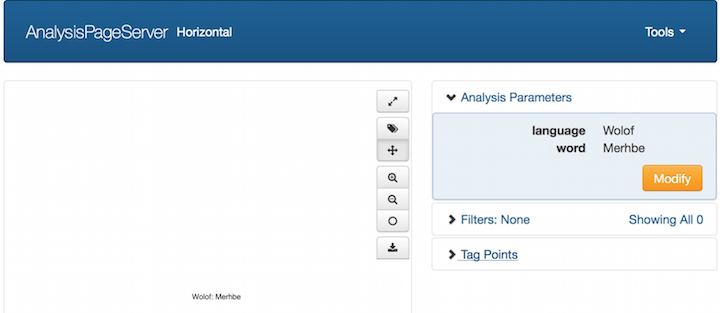
That's fine. Up until now we haven't demonstrated anything persistent,
much less conditionally persistent. But inside the browser's cache it
now remembers the English word "Hello" and the Wolof word
"Merhbe", both for this page and for the Vertical page. Let's switch
to the Vertical page:
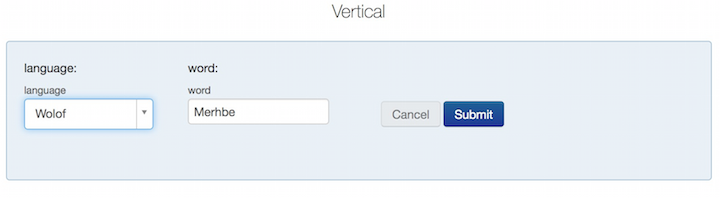
The form is initialized with the last language (Wolof) and word ("Merhbe"). This is the normal behavior for regular persistent parameters. Now, to demonstrate the conditional persistence, let's switch to English:
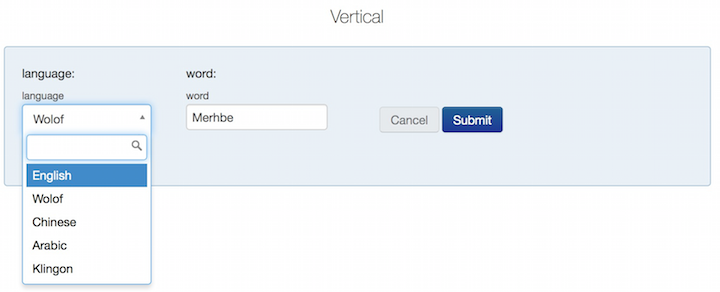
Once English is selected the word field automatically populates with
the last English word, "Hello":
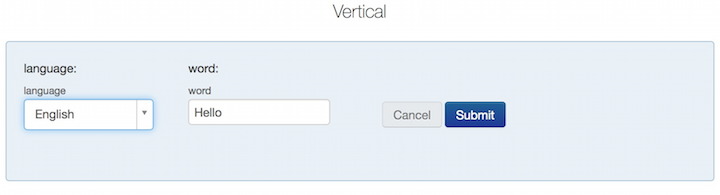
If we switch to a new language then the word field is simply reset:
"Rook >= 1.1 + fork not available"
Any parameter can be made advanced by providing advanced = 1 to its constructor. This means that by default
it will not show up unless the user exposes it by clicking the "advanced" icon.
Here is a very simple page which plots the sine function. The range will be from 0 to xmax, where the user
can type in xmax. The number of points used will default to 100, and the user will be allowed to change
that, but it will be a hidden, advanced parameter.
xmax <- simple.param("xmax", label = "Maximum Theta", value = pi)
n <- simple.param("n", value = 100, advanced = 1)
pset <- param.set(xmax, n)

handler <- function(xmax = pi, n = 100)  {
  xmax <- as.numeric(xmax)
  n <- as.numeric(n)
  x <- seq(0, xmax, length = n)
  y <- sin(x)

  plot(x, y, pch = 19, xlab = "Theta", ylab = "Sine(Theta)", main = "Sine curve")

  data.frame(x = x, y = y, Theta = x, `Sin(theta)` = y, check.names = FALSE)
}

page <- new.analysis.page(handler, param.set = pset, name = "sine", label = "Sine Plotter")
reg <- new.registry(page)
srv <- startRookAnalysisPageServer(reg, port = port)
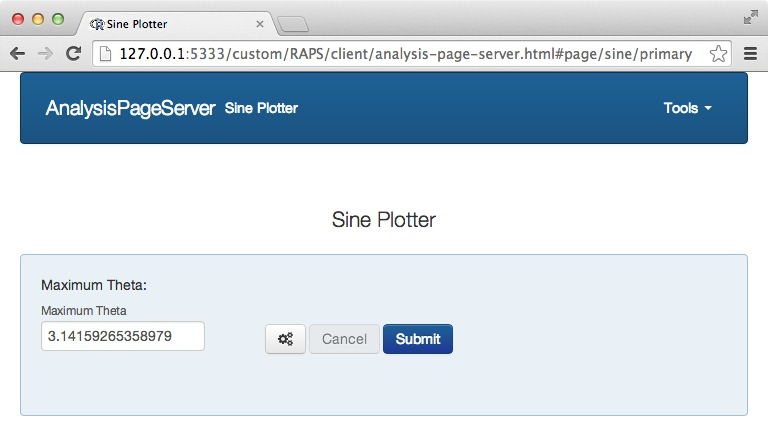
Note the appearance of the advanced icon ![]() next to the Cancel and Submit buttons. This indicates that there are hidden advanced parameters.
next to the Cancel and Submit buttons. This indicates that there are hidden advanced parameters.
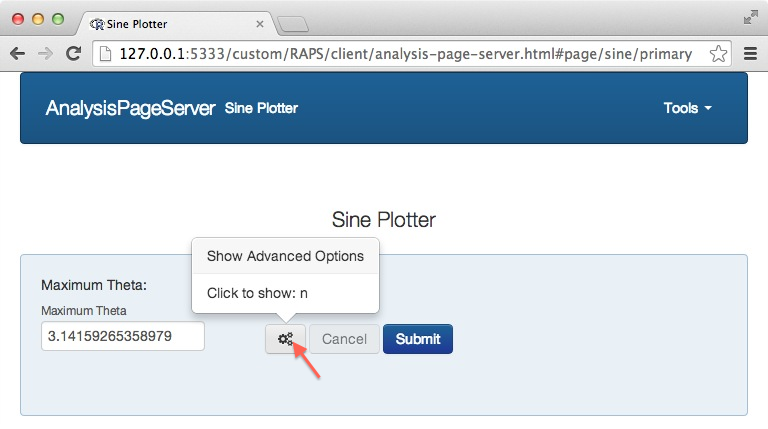
Rolling over the icon lists which parameters are missing, and clicking on it exposes them:
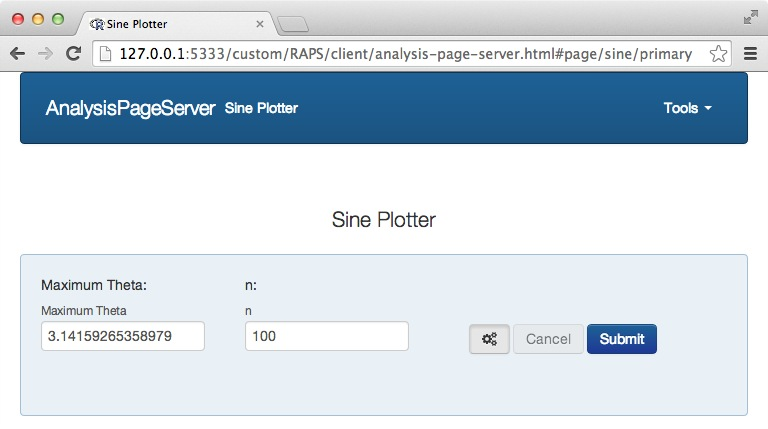
Note: When an analysis is submitted and advanced mode is off, the advanced parameter(s) are simply omitted from the function call. Typically this means that the function would use the default value for those parameters from the function definition. This does not necessarily match the default value for that parameter in the front end.
"Rook >= 1.1 + fork not available"
Aside from making it advanced, the visibility of a parameter can also be controlled by making it conditional on some other parameter.
Let's continue the example of the sine curve from the previous section. Let's suppose we want the user to be allowed to
specify either xmin or xmax. (We'll leave the widget for choosing n out of this example.)
We need three widgets---one to choose either xmin or xmax, and then one for each of xmin and xmax. And we need
to "program" the xmin and xmax to only display depending on the value of the first. This is
done with the show.if argument to the AnalysisPageParam constructor.
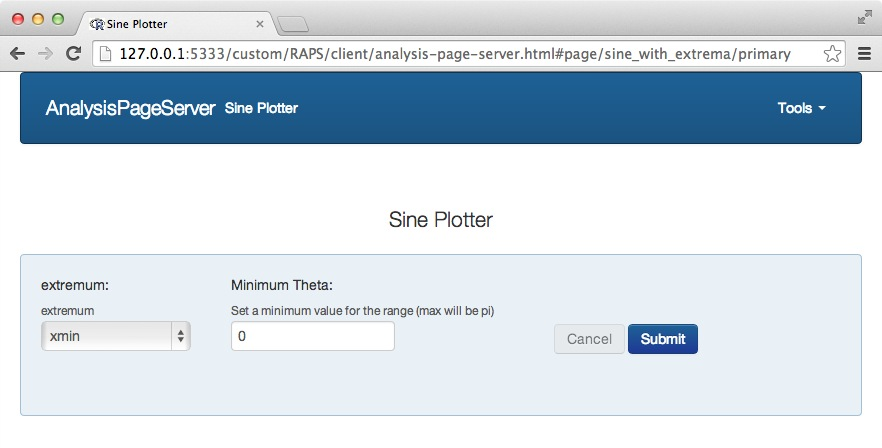
extremum.chooser <- select.param("extremum", choices = c("xmin", "xmax"))
xmin <- simple.param("xmin", value = 0, show.if = list(name = "extremum", values = "xmin"),
                     label = "Minimum Theta",
                     description = "Set a minimum value for the range (max will be pi)")
xmax <- simple.param("xmax", value = pi, show.if = list(name = "extremum", values  = "xmax"),
                     label = "Maximum Theta",
                     description = "Set a maximum value for the range (min will be 0)")
pset <- param.set(extremum.chooser, xmin, xmax)

handler <- function(extremum = "xmin", xmin = 0, xmax = pi)  {
  xmin <- if(extremum == "xmin") as.numeric(xmin) else 0
  xmax <- if(extremum == "xmax") as.numeric(xmax) else pi
  x <- seq(xmin, xmax, length = 200)
  y <- sin(x)
  plot(x, y, pch = 19, xlab = "Theta", ylab = "Sine(Theta)", main = "Sine curve")
  data.frame(x = x, y = y, Theta = x, `Sin(theta)` = y, check.names = FALSE)
}
page <- new.analysis.page(handler, param.set = pset, name = "sine_with_extrema", label = "Sine Plotter")
reg <- new.registry(page)
srv <- startRookAnalysisPageServer(reg, port = port)
This page's parameter area starts out looking like this:
If the user selects "xmax" for the extremum then the second widget changes:
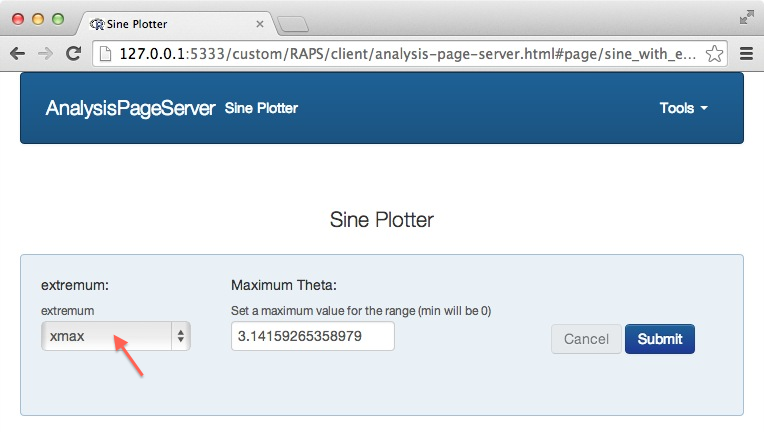
Really two things happen---the xmin widget disappears and the xmax widget appears.
"Rook >= 1.1 + fork not available"
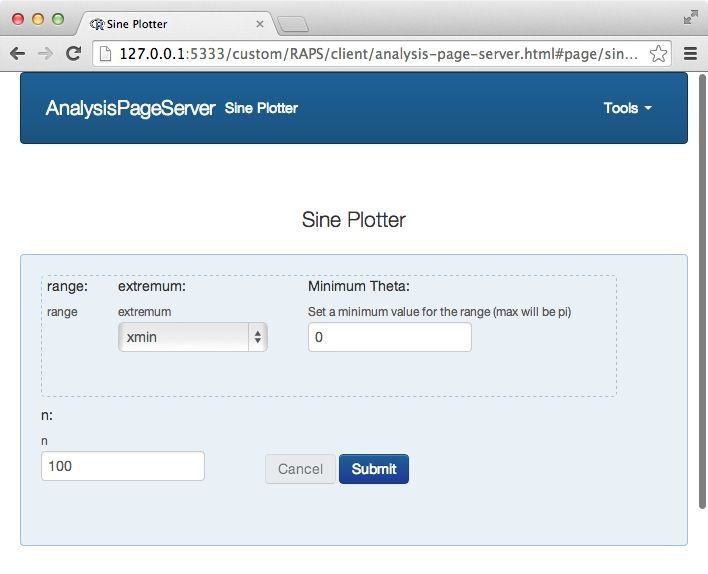
Sometimes a finite set of parameters are logically linked. For example, in the previous section we had the 3 widgets to select an extremum. If we added back in a widget to choose how many points, then it is somehow logically distinct from the other three. It would be nice both from the user interface point of view and also from the engineering point of view to reflect this. Let's put those three in a single "compound"-type parameter. Then they will be visually separated from the fourth parameter for the user, and also provided to the handler packed into a single list.
The constructor compound.param is expecting an AnalysisPageParamSet, the same object
that we can pass to new.analysis.page.
range.paramset <- param.set(extremum.chooser, xmin, xmax)
range <- compound.param("range", children = range.paramset)
n <- simple.param("n", value = 100)
pset <- param.set(range, n)

handler <- function(range = list(extremum = "xmin", xmin = 0), n = 100)  {
  xmin <- if(range$extremum == "xmin") as.numeric(range$xmin) else 0
  xmax <- if(range$extremum == "xmax") as.numeric(range$xmax) else pi
  x <- seq(xmin, xmax, length = as.numeric(n))
  y <- sin(x)
  plot(x, y, pch = 19, xlab = "Theta", ylab = "Sine(Theta)", main = "Sine curve")
  data.frame(x = x, y = y, Theta = x, `Sin(theta)` = y, check.names = FALSE)
}
page <- new.analysis.page(handler, param.set = pset, name = "sine_with_extrema", label = "Sine Plotter")
reg <- new.registry(page)
srv <- startRookAnalysisPageServer(reg, port = port)
The parameter area now looks like this:
Combining show.if, array.param and compound.param one can thus create arbitrarily nested and complex
parameters. For example, the prototype for an array.param could be a compound.param. Then each time the user
clicks on + a extra row of parameters would appear. This could be used to input first and last names for a list of
people.
kill.process(srv)
"Rook >= 1.1 + fork not available"