ggmultiglyph:
Multivariate Data Visualization using Glyphs
ggmultiglyph:
Multivariate Data Visualization using Glyphs
Division of Germplasm Conservation, ICAR-National Bureau of Plant Genetic Resources, New Delhi.









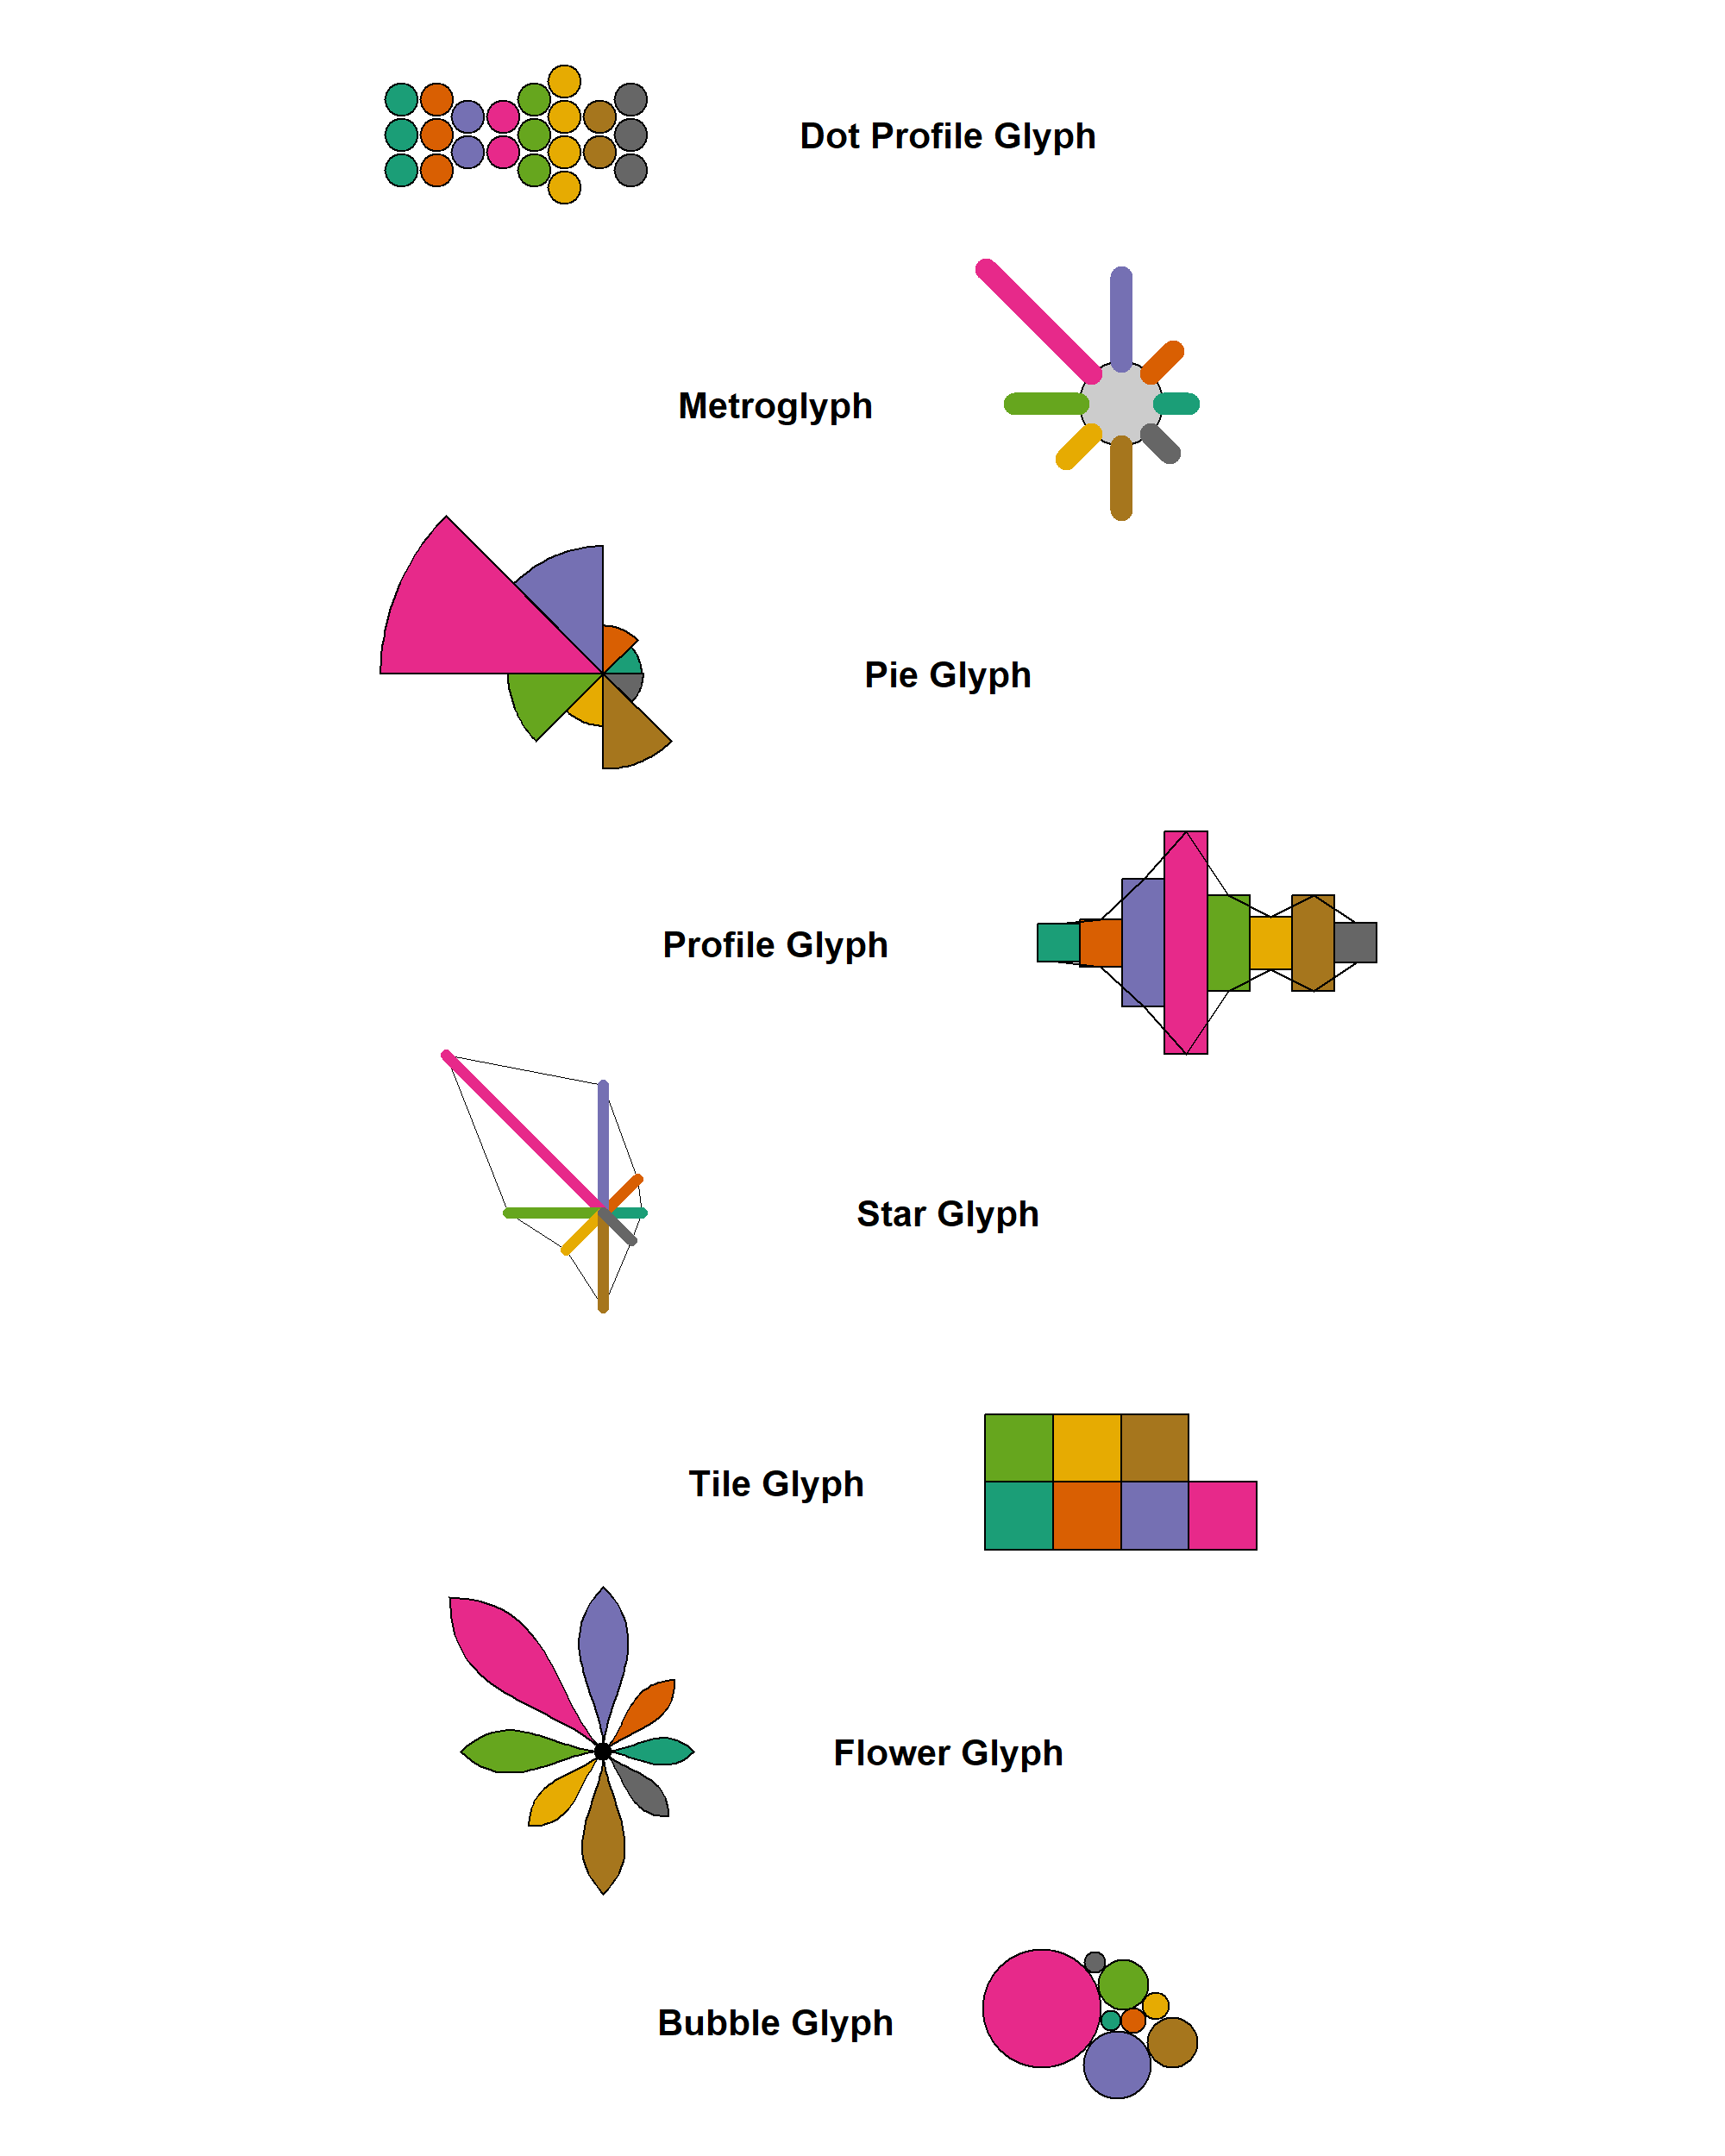
Provides ‘ggplot2’ geoms for visualizing multivariate data using glyphs. The package implements several established glyph designs described in the information visualization literature, including the review by Borgo et al. (2013) doi:10.2312/conf/EG2013/stars/039-063.
The development version can be installed from github as follows:
# Install development version from Github
devtools::install_github("aravind-j/ggmultiglyph")To know whats new in this version type:
news(package='ggmultiglyph')ggmultiglyphTo cite the methods in the package use:
citation("ggmultiglyph")To cite the R package 'ggmultiglyph' in publications use:
Aravind, J. (2026). ggmultiglyph: Multivariate Data Visualization using Glyphs. R package version 0.1.0,
https://aravind-j.github.io/ggmultiglyph/.
A BibTeX entry for LaTeX users is
@Manual{,
title = {ggmultiglyph: Multivariate Data Visualization using Glyphs},
author = {J. Aravind},
note = {R package version 0.1.0 https://aravind-j.github.io/ggmultiglyph/},
year = {2026},
}
This free and open-source software implements academic research by the authors and co-workers. If you use it, please support the
project by citing the package.